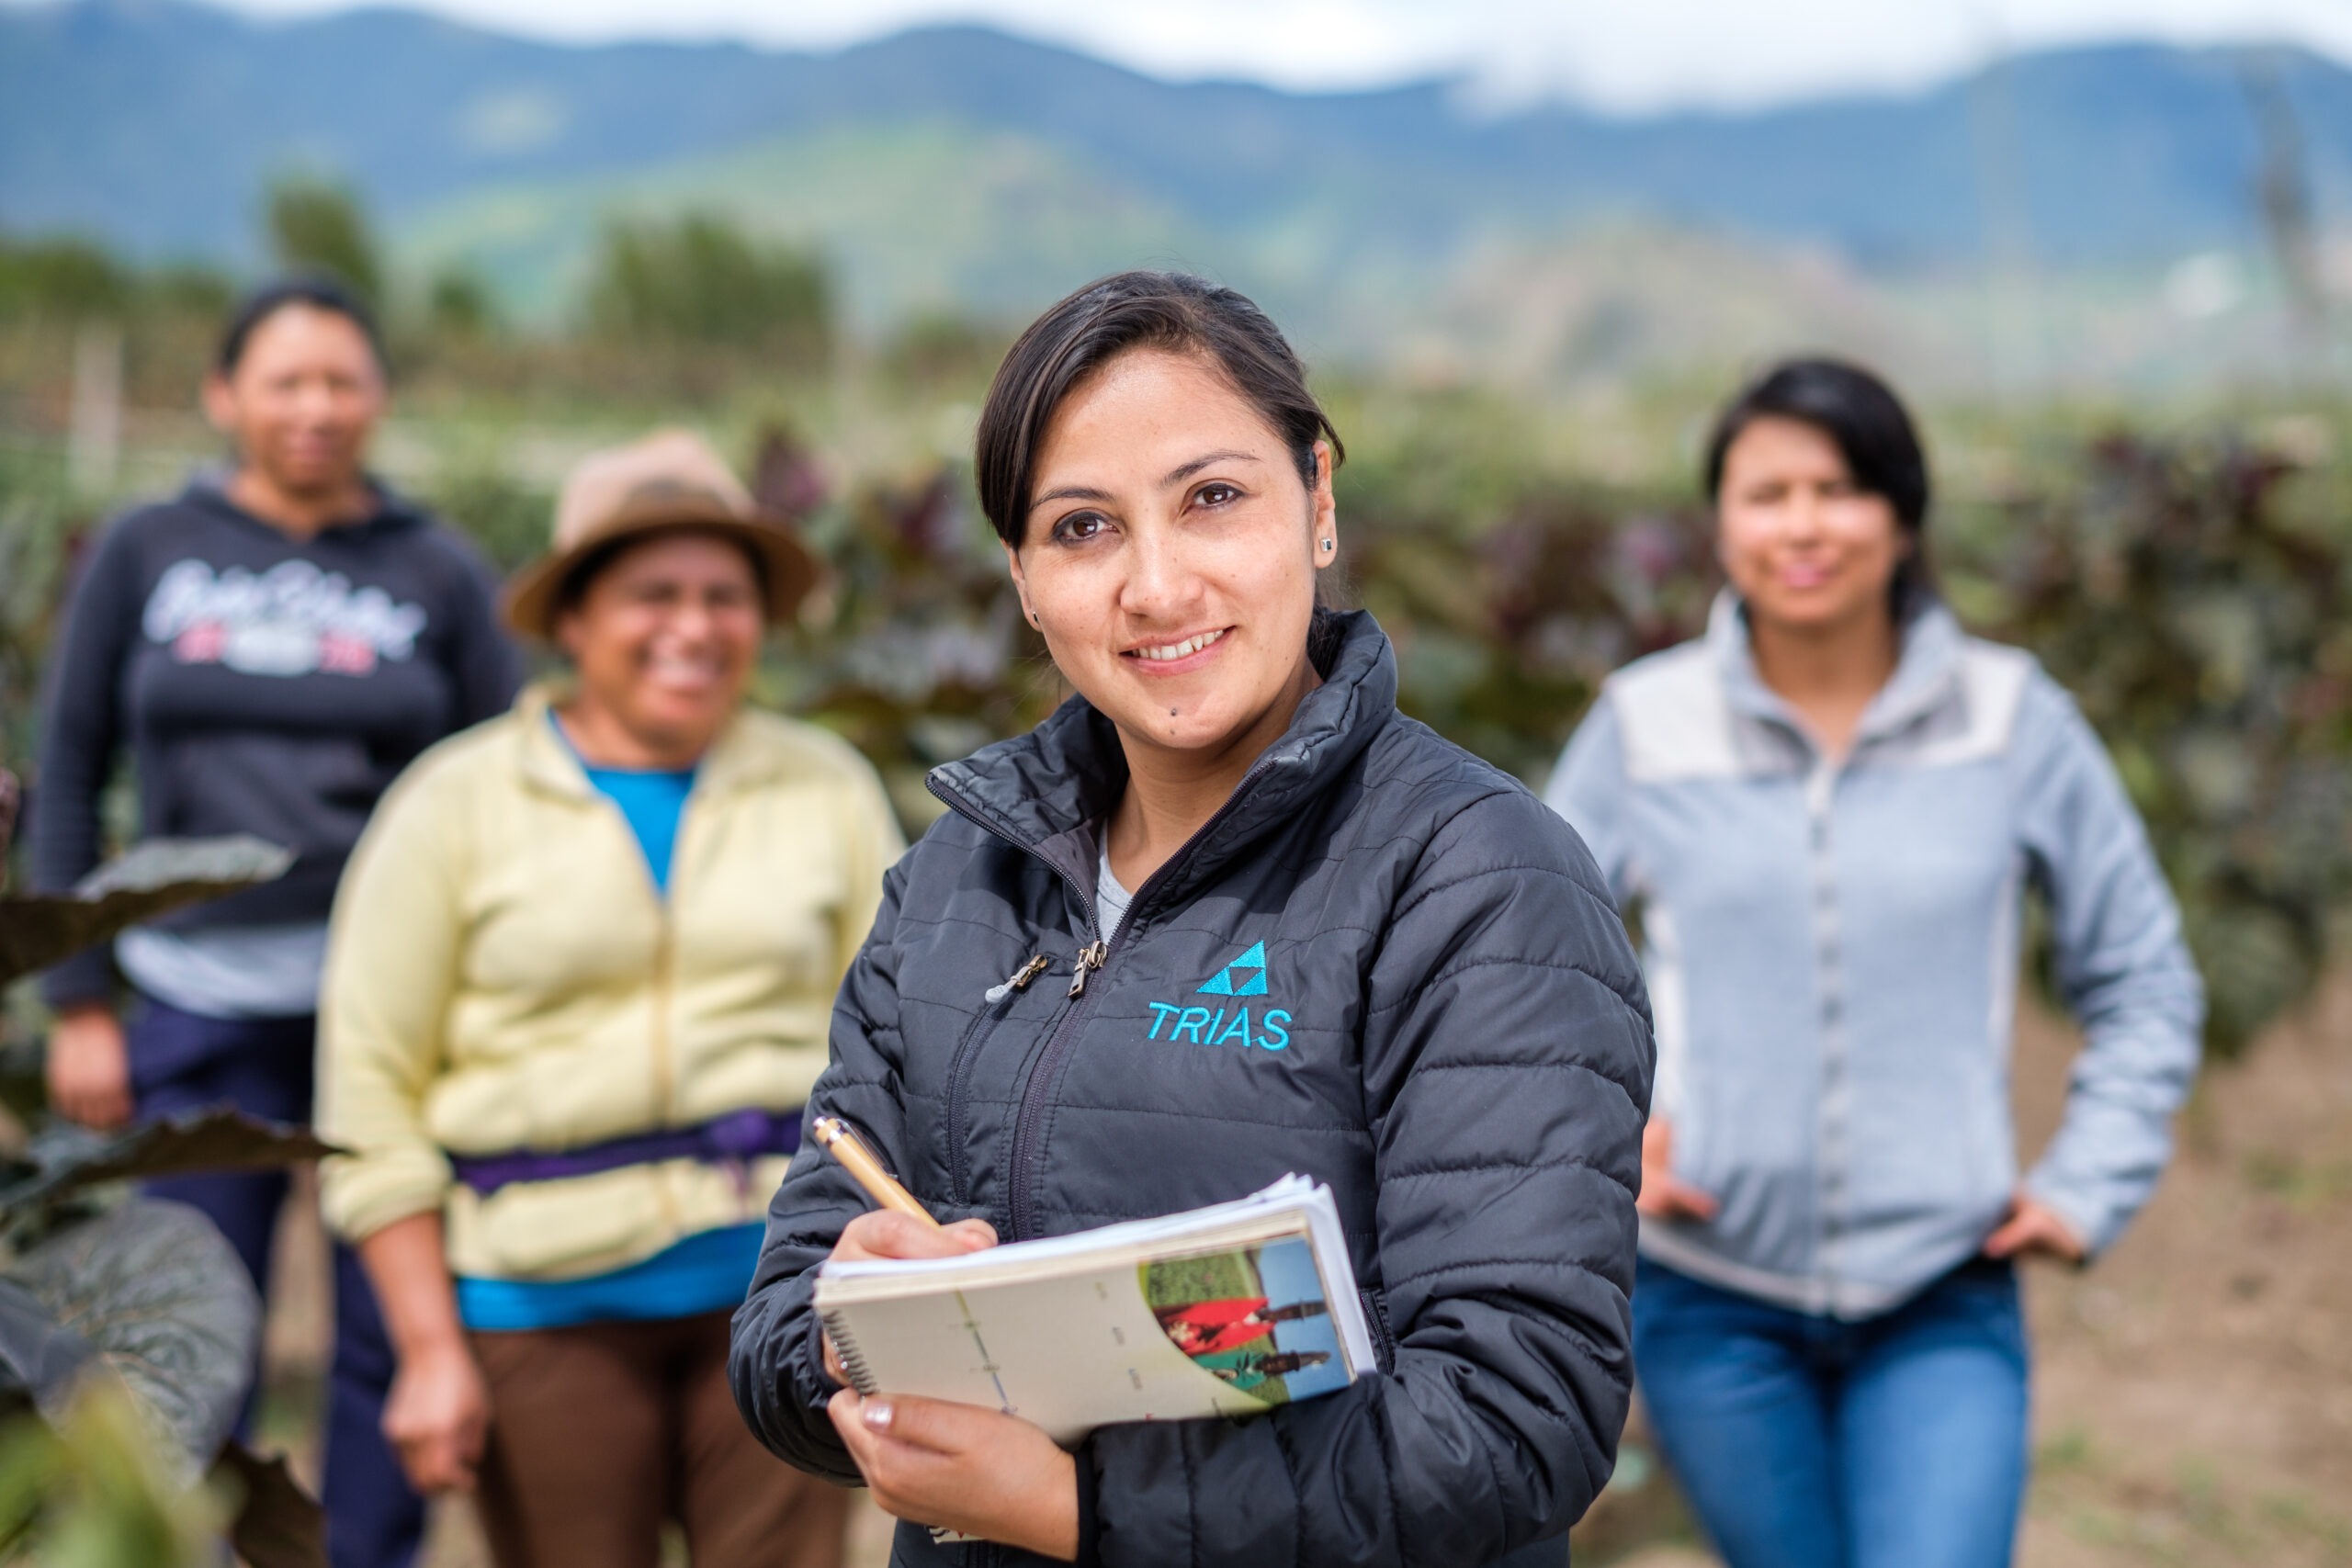
OUR Expertise
Trias has 50 years of experience in working with farmers’ and entrepreneurs’ organisations all around the globe.
We work with them, support their activities and give advice. In this way we want to create strong, independent organisations that can provide better services to their members.
OUR FOCUS: people, planet & profit

PEOPLE: INCLUSION & GLOBAL CITIZENSHIP
We focus on women, youth and economically underprivileged people within our partner organisations, making sure no one is left behind. To do so, our work focuses on self-confidence, motivation and self-awareness of these groups and their leaders. We look at amplifying their positive actions and strengths and actively address the power relations that inhibit their inclusion and active participation in their organisation and wider community. The notion of global citizenship and solidarity is an integral part of our empowerment approach.
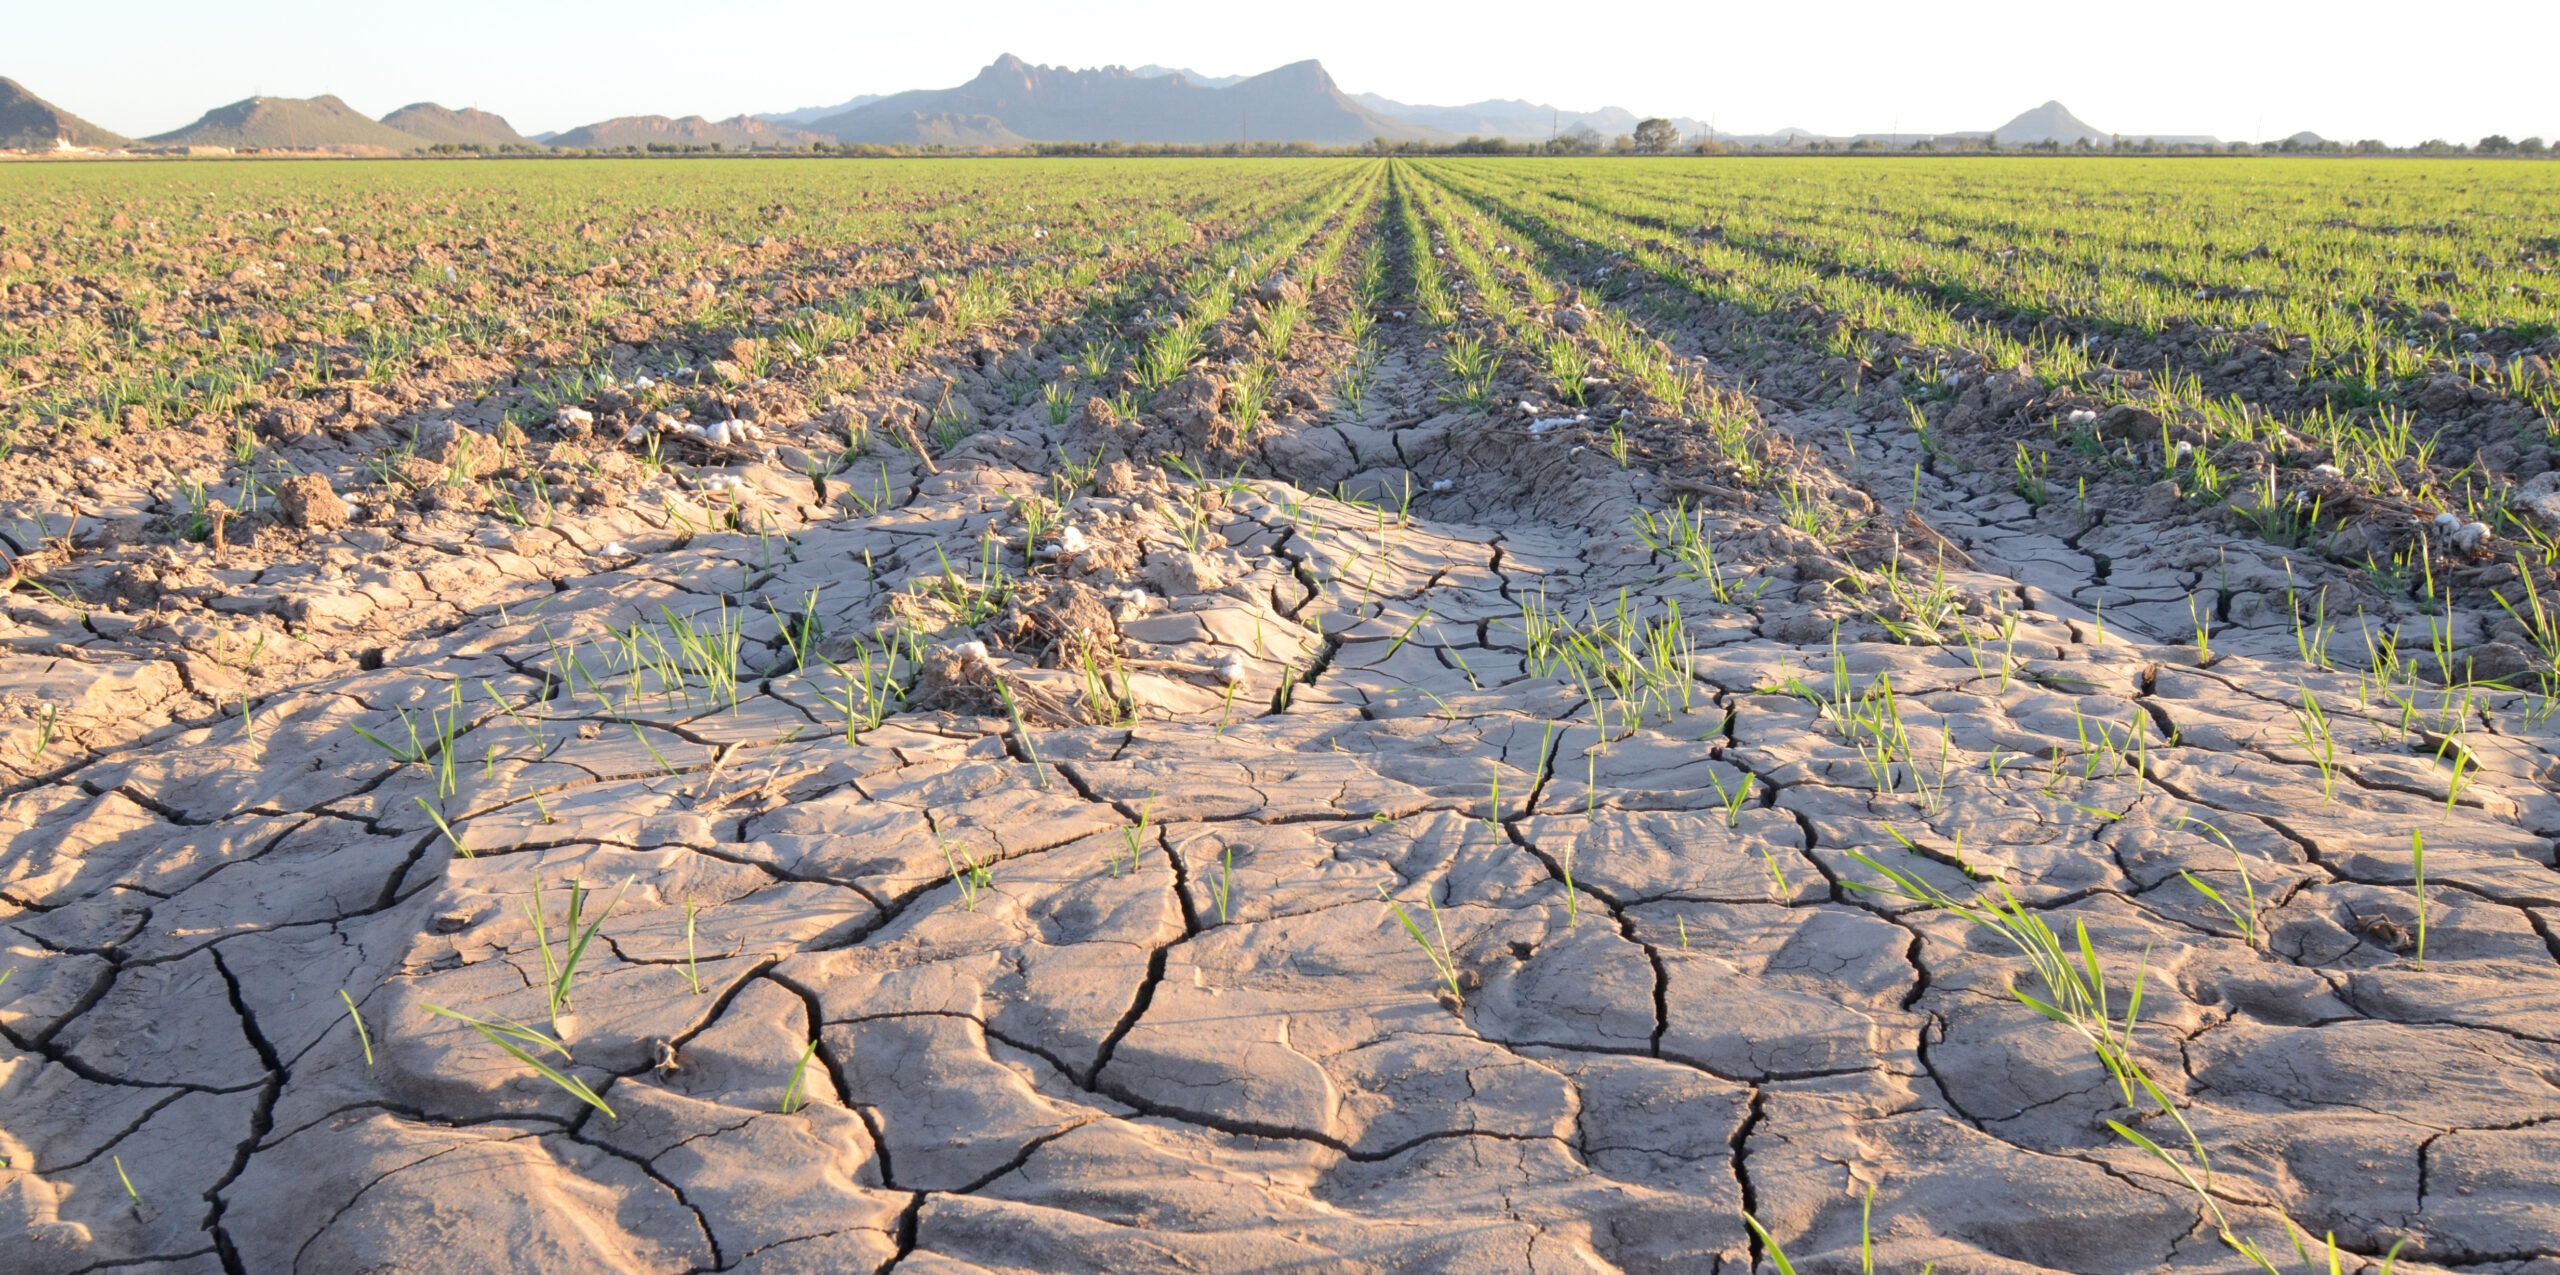
PLANET: CLIMATE CHANGE & ENVIRONMENT
Through our climate change and environmental sustainability strategy, we contribute to strengthening our partners disaster and risk resilience as well as their inclusive climate change adaptation and mitigation actions. Our partner organisations first define their own change trajectory to address climate change and environmental degradation, based on their specific internal and external needs

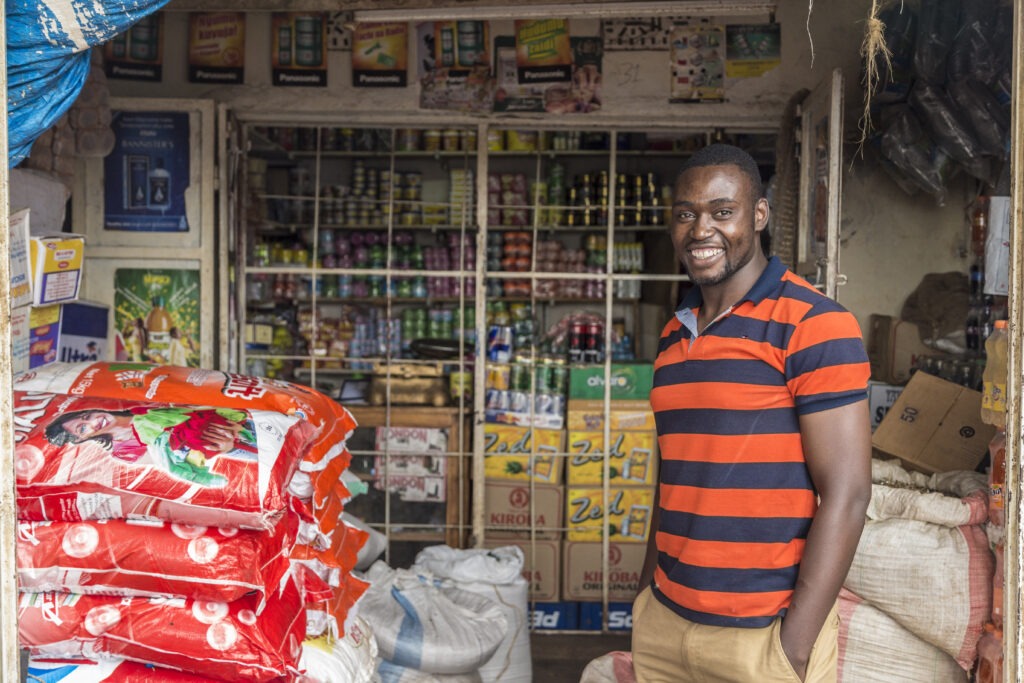
PROFIT: BUSINESS DEVELOPMENT & MARKET ACCESS
We assist our partner organisations to strengthen the production, income and livelihood of their members in an inclusive way. We support them in becoming increasingly financially self-sufficient and in creating conditions that foster equal opportunities in order to grow their businesses and access potential markets. Trias actively encourages and activates the entrepreneurial spirit, attitudes and capacities of the leaders, management and members of our partners. A cooperative mindset, savings culture and access to investment capital have proven to be key for this.
INCLUSION & GLOBAL CITIZENSHIP
Trias wants equal opportunities for all. We strive to build an inclusive world in which everyone can be themselves and can participate in society on an equal basis.
We encourage the organisations of family farmers and entrepreneurs we work with to become more inclusive. After all, these organisations can only thrive when all members feel safe to express themselves openly, can participate and contribute to decision-making evenly and see their needs addressed. Trias plays an important role in this process by providing trainings on leadership and inclusion to the members of these organisations. In doing so, we try to illustrate that everyone benefits from an inclusive society.
We aim to play an active role by facilitating peer-to-peer exchanges between entrepreneurs, triggering change and taking up an active role in creating a world where benefits are more equally shared.
“We focus explicitly on women, youth and other underprivileged groups in this process because they have more obstacles to overcome in society at large.”
Kimberly Gutiérrez, Inclusion Advisor Trias Central America & the Carribean
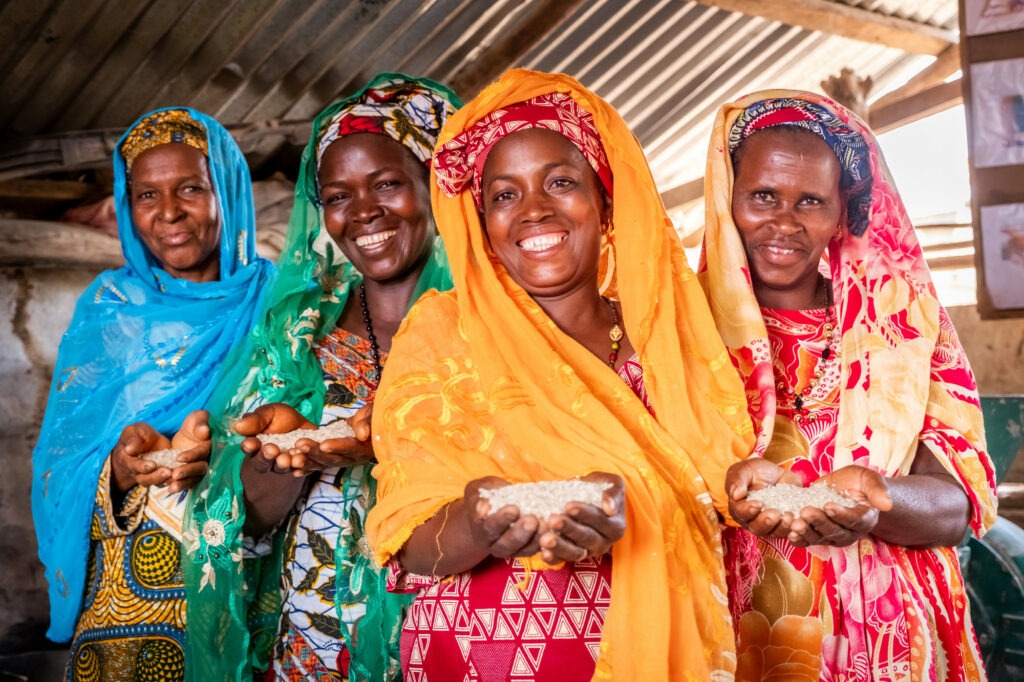
Promoting inclusion in West Africa
In order to facilitate inclusion processes, Trias has developed a toolbox, which starts from the constraints of each organisation.
In Guinea and Burkina Faso, this has significantly improved the participation of women and young people in decision-making and the functioning of their organisations, where before they were excluded. Moreover, it helped to institutionalize gender quotas, develop leadership skills of women and youth, create financial empowerment and facilitate their access to services and land ownership.
Empowering youngsters in Tanzania
Youth unemployment is a widespread problem all over the African continent. In order to fight this and create equal opportunities for young people, Trias launched the YEP program, a joint effort with local Chamber of Commerce TCCIA, in Tanzania in 2017.
During the program, young entrepreneurs were trained in soft, business and vocational skills and received help with business plans and funding. Next to that, a strategy was devised for TCCIA to reach more youngsters and develop specific services for them. By the end of 2021, 169 young people had followed such a training program and TCCIA more than doubled its youth membership.
Raising awareness in Belgium
In Flanders we develop group workshops around topics like cocoa, coffee and fair trade.
During a fun activity, participants are made more aware of the inequality and injustice of the global system we live in. They leave the session feeling more responsible to contribute themselves to a more equitable and just world by changing their purchasing behaviour or eating habits. In that way, Trias gives them the push they need to get on the track of becoming citizens of the world.
CLIMATE CHANGE & ENVIRONMENTAL SUSTAINABILITY
Trias is committed to strengthen our partners so they’re better equipped
to deal with the consequences of climate change.
The impacts of climate change are extremely devastating for the most vulnerable groups and a sustainable approach to farming and entrepreneurship naturally has to be adjusted to today’s climate challenge. We invest together with our partners in sustainable and ecological entrepreneurship.
We are actively committed to making our partners more sustainable. For example, we are looking at sustainable and circular production and marketing alternatives to reduce greenhouse gas emissions, the use of plastics and chemicals, and the production of waste as much as possible.
“Our priority goes to building resilience in such a way that partners and their members can bounce back faster and stronger when confronted with climate and ecological shocks, while at the same time investing in long term ecological resilience.”
Gudrun Cartuyvels, Coordinator Climate Change & Ecological Sustainability, Trias

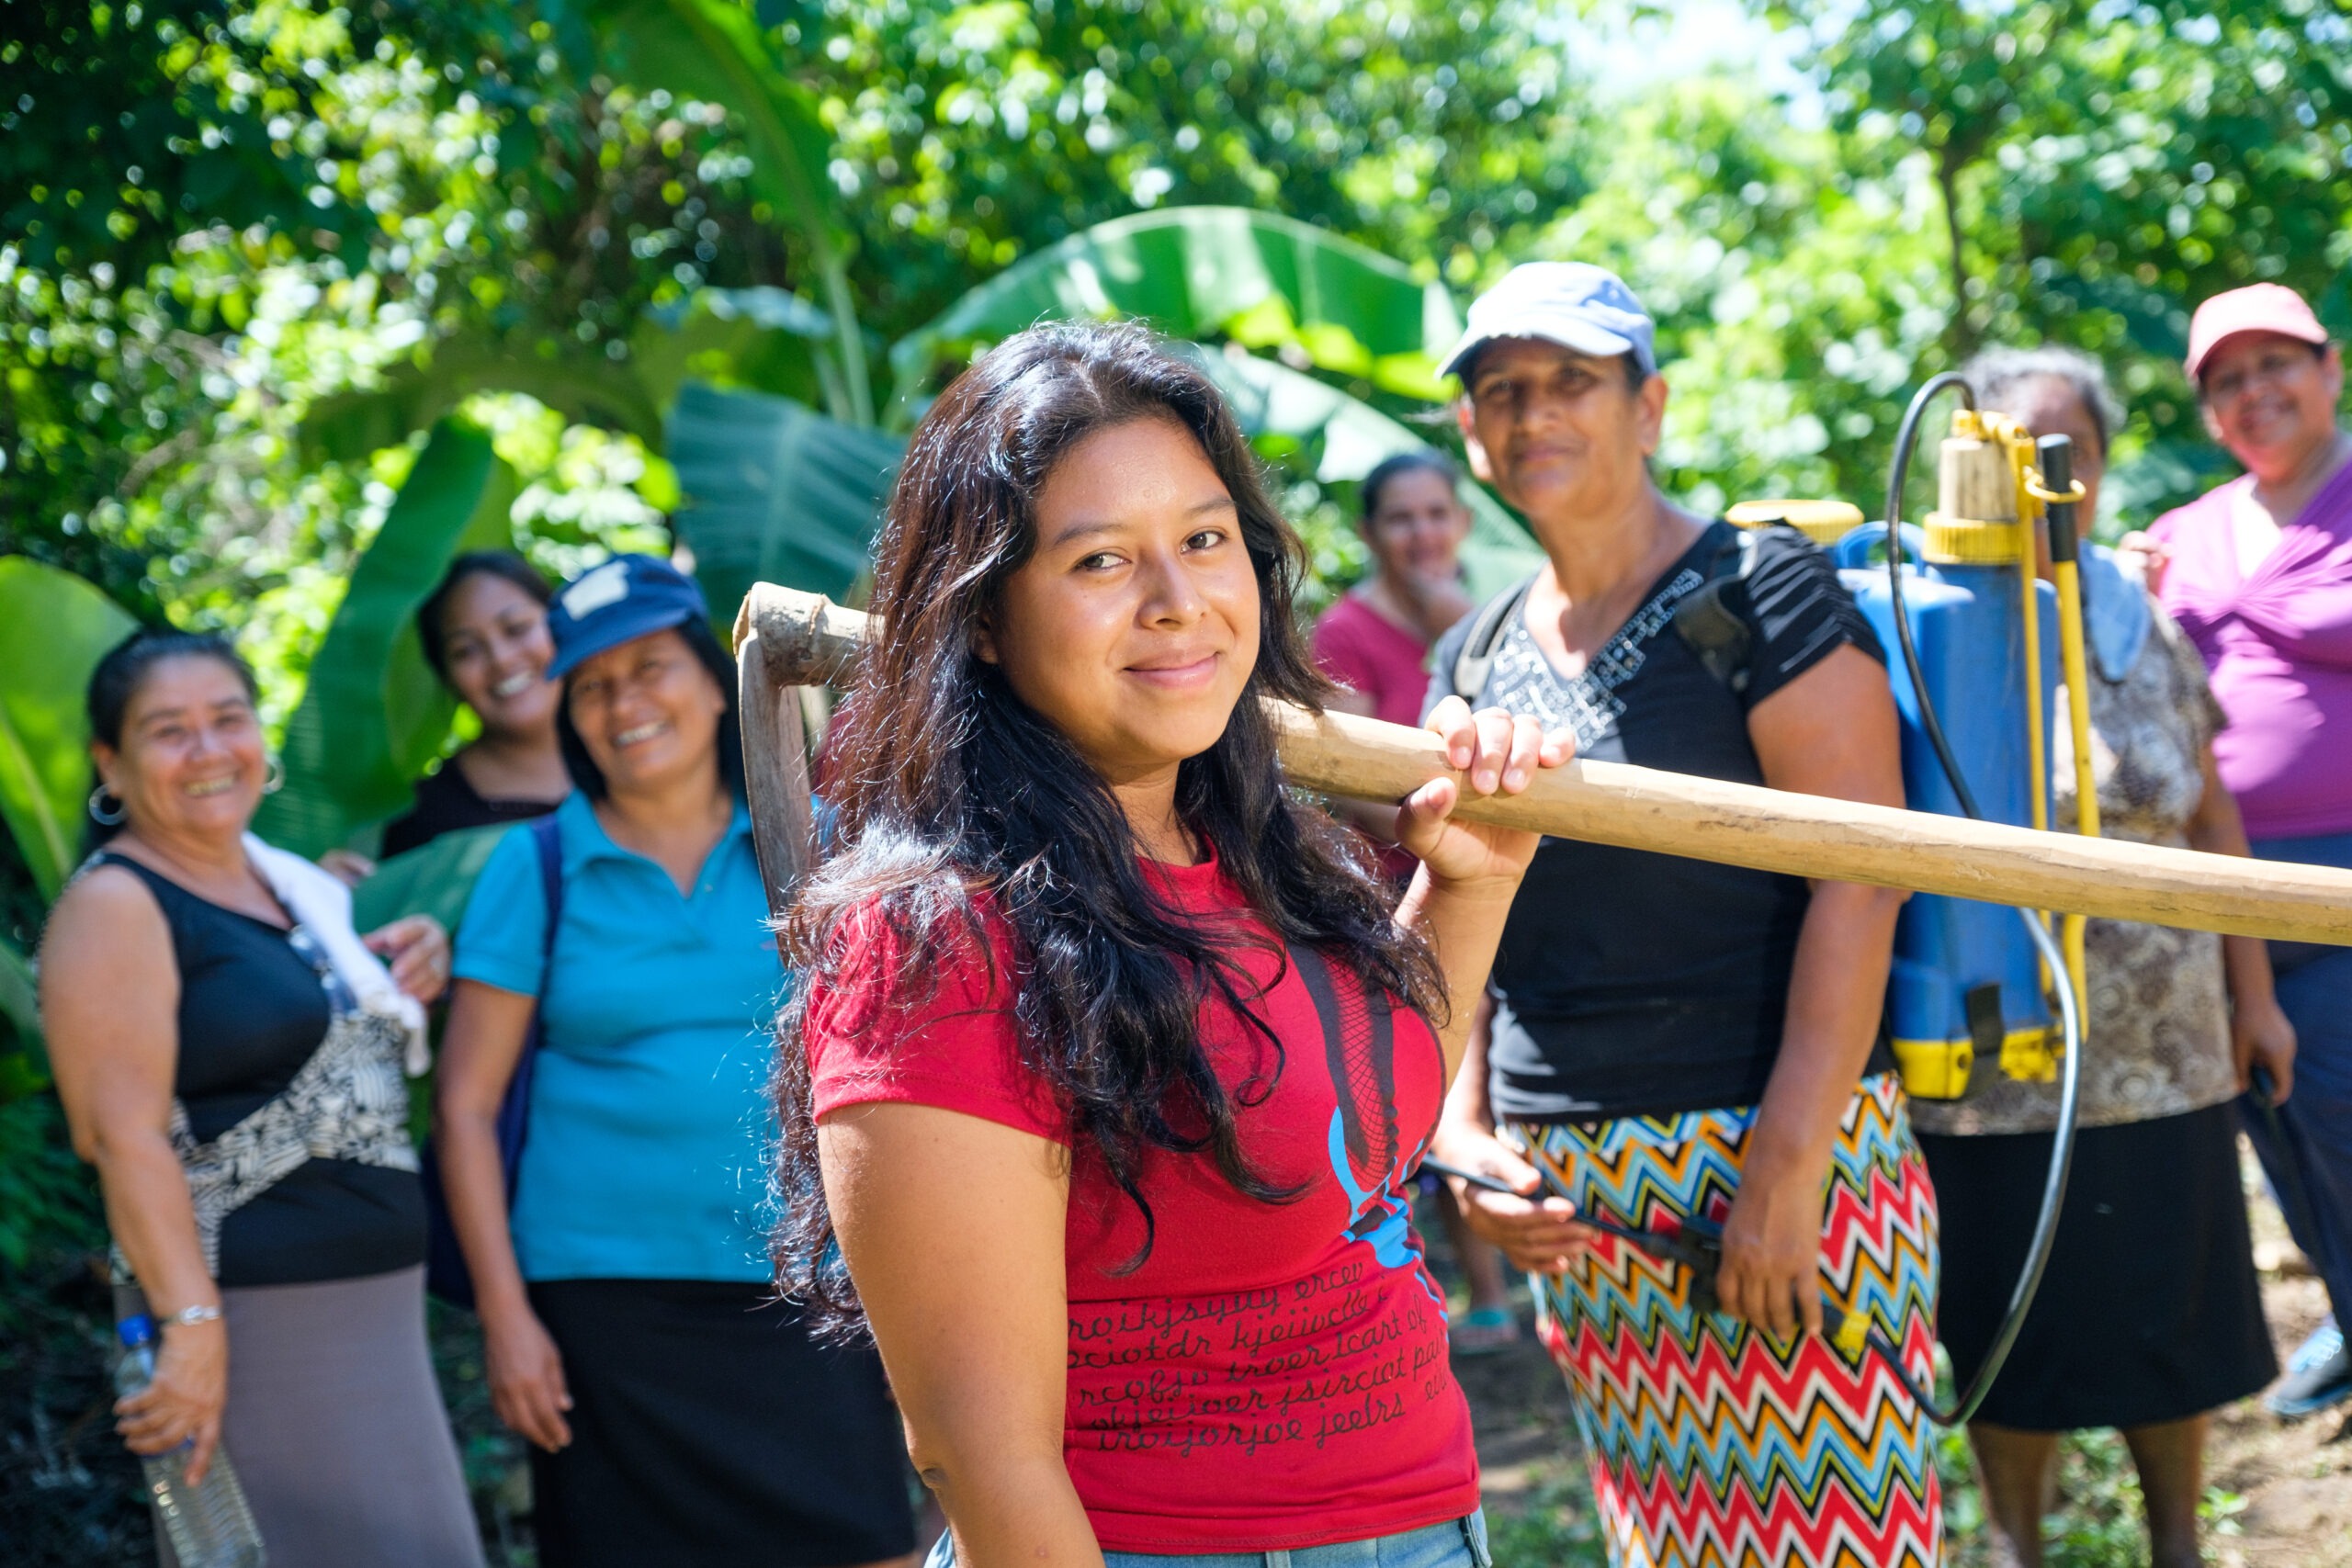
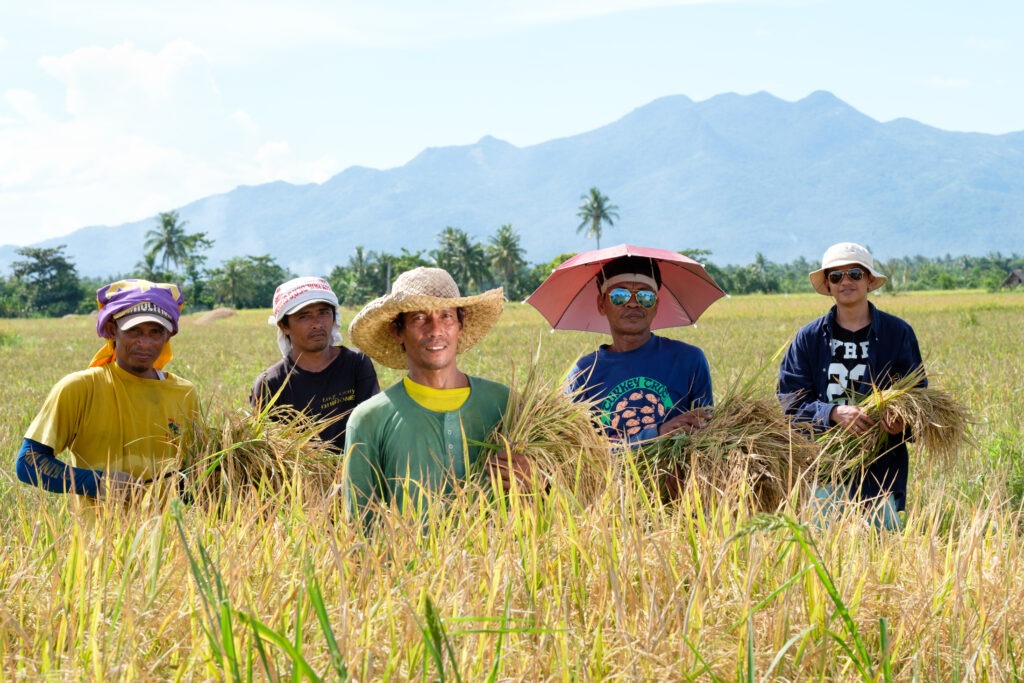
Resilient agricultural production in El Salvador
ACOPRO AMATE, a cooperative of young producers from the eastern part of El Salvador, is now growing vegetables such as chilies and tomatoes in a sustainable way, thereby reducing the use of agrochemicals. Trias has accompanied them with training, technical assistance and capacity building in good agricultural practices and resilience towards climate change.
The members of ACOPRO AMATE are also contributing to the revitalization of the local economy, by generating employment for the care of the greenhouses and in the commercialization of their products.
Our work on Disaster Risk Reduction & Management
The Bicol Region in the Philippines is frequently affected by typhoons, leading to repeated devastation in the lives and livelihoods of family farmers. With the support of Trias, the Bicol Federation of Dairy Cooperatives (BFDC) therefore initiated a Disaster Risk Reduction and Management training for farmers and their households.
As members became more acquainted with the process, farming communities became more disaster resilient and able to build back better after calamity strikes. This lessens income loss, improved members’ confidence, and increases networks via lobbying and advocacy, which are critical in becoming disaster-resilient communities.
business development & market access
Trias strives to create opportunities for aspiring entrepreneurs so they shift from idea
to becoming active entrepreneurs and transforming their plans into action.
Business development and market access are a key focus in our work. We aim to improve entrepreneurs’ production, income and livelihoods in an inclusive and environmentally friendly way.
We do this by supporting entrepreneurial development and market access by relying on innovative approaches and tools. This includes facilitating training on entrepreneurial skills, support with market access, strengthening our partners to increase their access to financial services such as credits, savings, insurances and more.
“It is especially invaluable for women, young people and disadvantaged groups to be supported to start a business in a sustainable way and to gain access to markets and financing. Only in this way can they create their own opportunities.”
Ritha Tarimo, Country Coordinator Tanzania, Trias East Africa
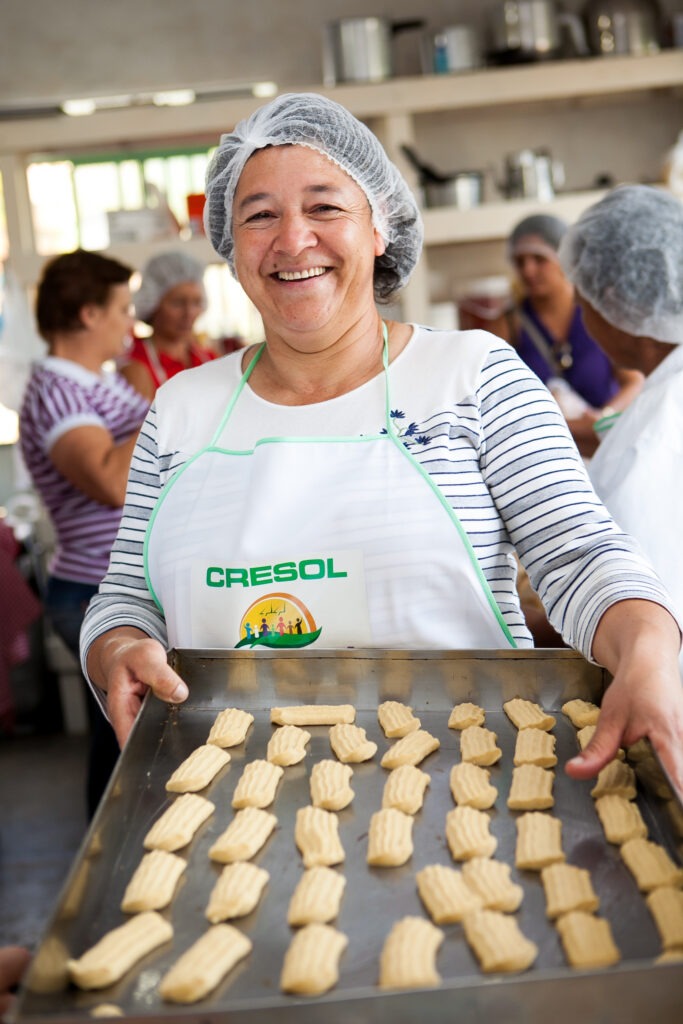
Access to microcredit in the Brazilian Amazon
Access to microcredit in the Brazilian Amazon is a major challenge, so it must be accompanied by technical advice. Around 30 families, through our partner Cresol, accessed financing with the aim of promoting productive diversification. The project allowed these families to make investments, such as the purchase of inputs and equipment for the production of vegetables and small livestock. This diversification of production allows families to supplement their income, especially during the periods between açaí harvests, the main food that many families gather in the Amazon.
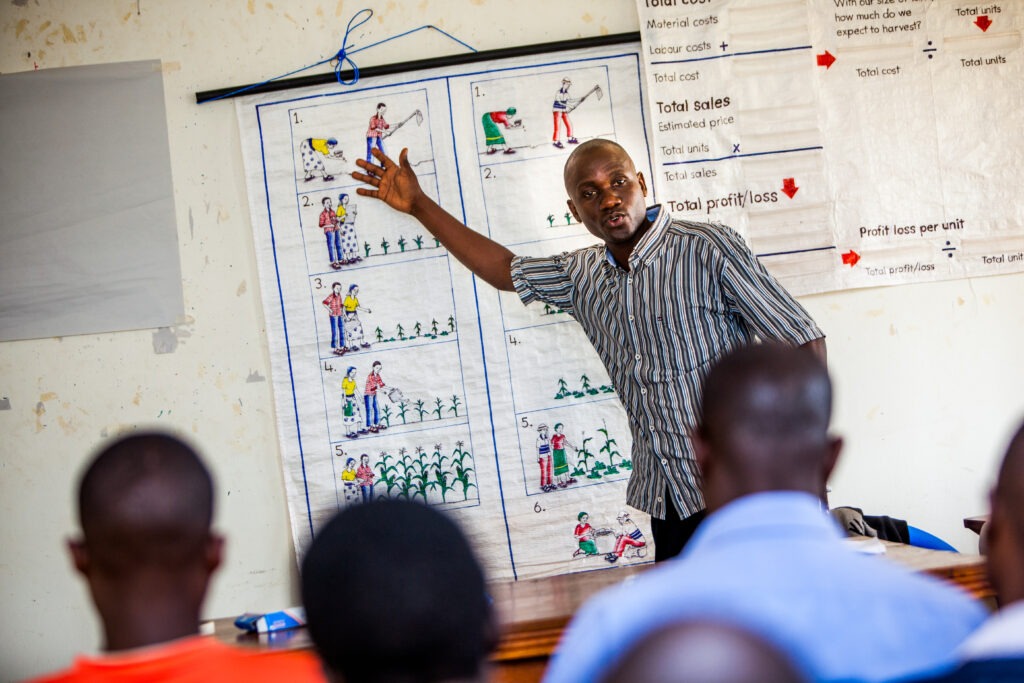
Enabling rural innovation in Uganda
Through training extension staff of our partners in ERI (our tool for Enabling Rural Innovation), we managed to move farmers from subsistence farming to semi-commercial levels using collective action to increase their incomes. In this way, many farmers’ groups formed Smallholder Farmer Group Associations (SFGAs).
In Uganda, 11 of such SFGAs have evolved into and are now registered as cooperatives, meaning they are considered bankable by financial institutions.
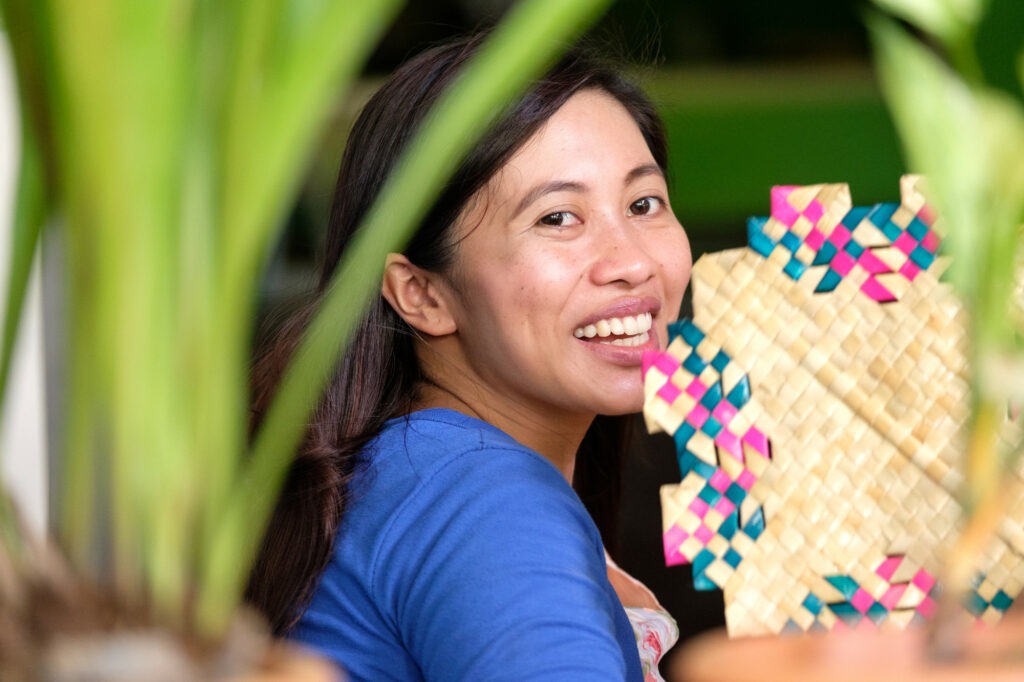
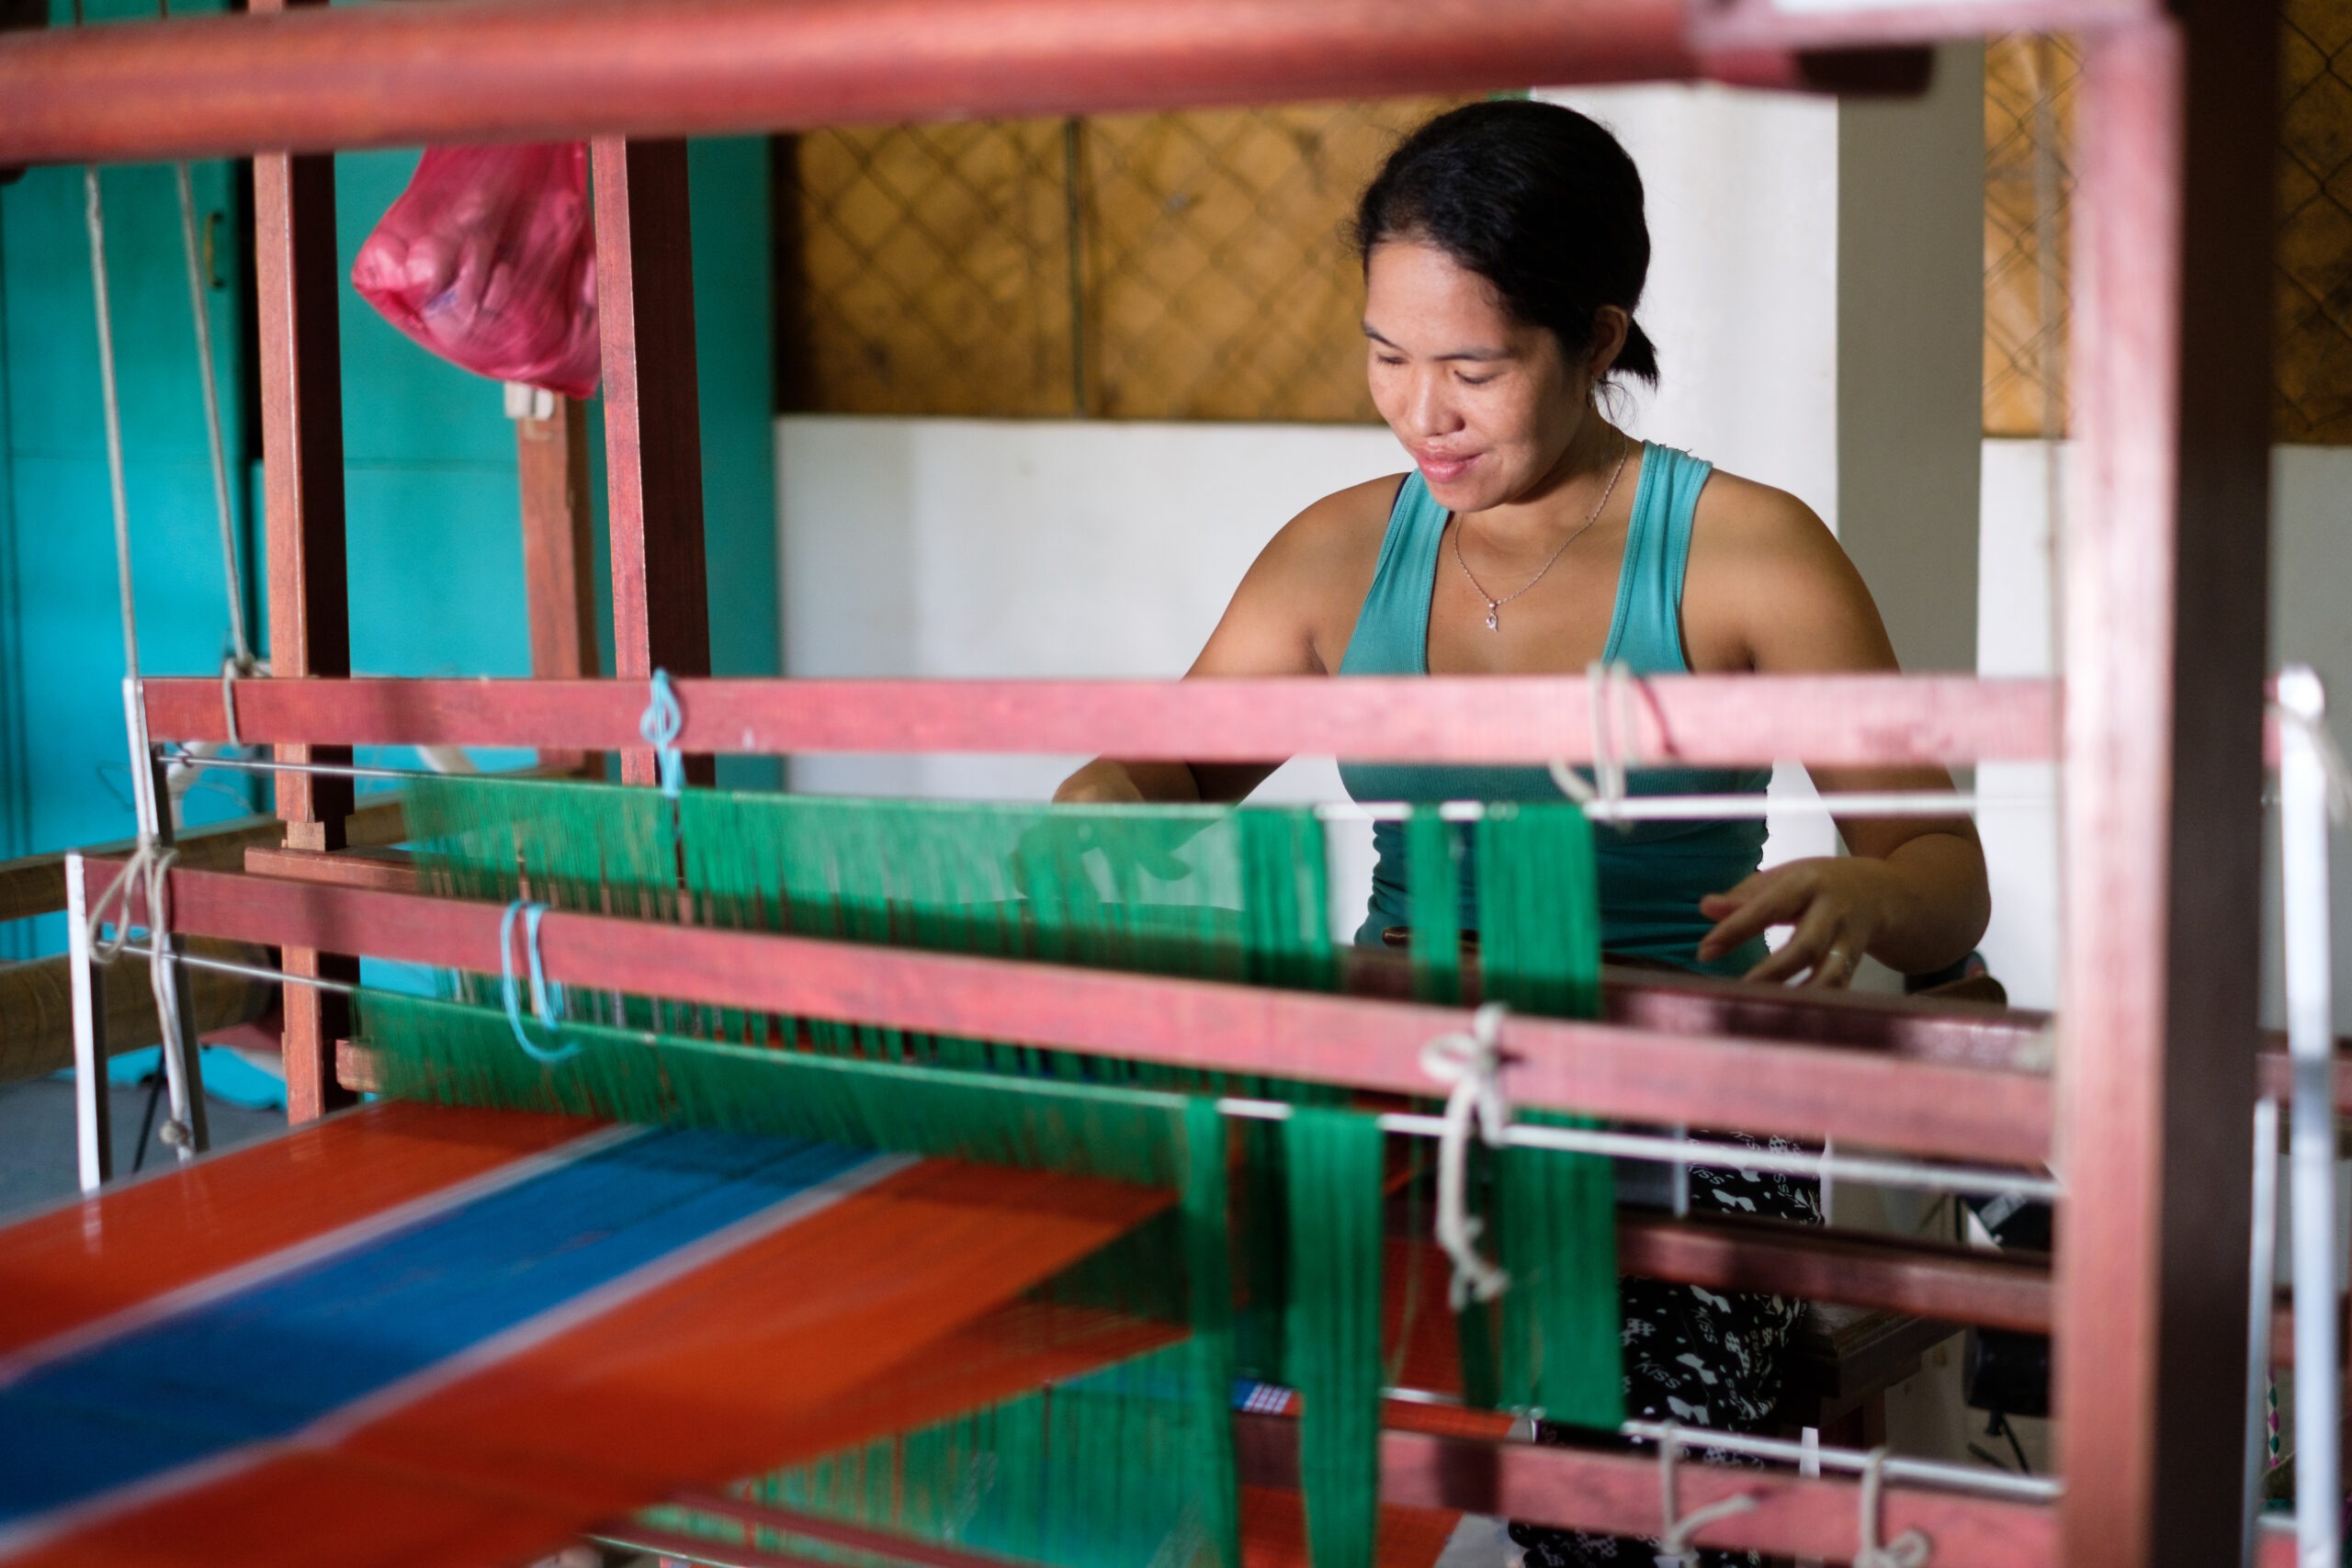
Weaving a future in the Philippines
The rural areas of Labo in Camarines Norte are prone to
deforestation, mainly due to logging and charcoal making. For the local community however, this is often their main source of income. The Tao-Kalikasan Foundation of the Philippines Inc. (TKFPI) therefore aims to provide community members with other livelihoods options through restoration, management and utilisation of natural resources.
With support from Trias, they started a handicrafts business which now provides income to many weavers. The business started expanding when a direct buyer for exportation approached TKFPI, which strongly increased the volume of production. TKFPI now has 284 direct beneficiaries in its abaca (Manila hemp) business.
Want to know even more?
Have a look at our tools & publications

our tools
Trias has developed quite soms tools and methods to better support our partners. Learn more about what we offer.
our publications
Take a look at our various publications.
From all annual reports to our strategy note.